Karnav Popat, Vishnu Prakash, Joyojeet Pal
Click here for the interactive resource
Introduction
The Indian-American community has become an increasingly prominent demographic in the U.S. political landscape. From 2000 to 2023, the Indian-American population has grown more than 150%, from 1.9 million to more than 4.9 million residents (Pew Research Center, 2024) (AAPI Data, 2023). As of 2023, Indian-Americans are projected to be the largest Asian-American subgroup in the United States, forming 1.5% of the total U.S. population.
Indian-Americans are also a particularly affluent and influential sub-group with an oversized presence in technology, finance, healthcare, academia and other high-paying professions, and increasingly also visible in politics and administration through figures who have been prominent on the national stage, including presidential candidates Kamala Harris, Vivek Ramaswamy, Bobby Jindal, and Nikki Haley.
A record of six Indian-Americans were elected to Congress in the 2024 elections – Ami Bera (CA‑7), Ro Khanna (CA‑17), Raja Krishnamoorthi (IL‑8), Pramila Jayapal (WA‑7), Shri Thanedar (MI‑13), and Suhas Subramanyam (VA‑10). This is up from only one in 2012. Indian-Americans’ remarkably high political engagement is evidenced by a 71% voter turnout in the 2020 election, the highest among Asian American subgroups (AAPI Data, 2021).
Despite these clear indicators of the community’s growing influence on and engagement with America’s political direction, it has been difficult to quantify their impact. One high-quality indicator of political engagement is campaign contribution records, which reveal detailed information about contributors’ preferences and alignments across the United States every electoral cycle.
In US elections, the general marker for a community or interest group’s play in politics is the extent to which it engages financially with the political process. The Indian community, besides finding representation in circles of power across fields, has started to emerge slowly as a group with a footprint on political funding. To better understand the political behaviour of Indian-Americans, we compiled and analyzed a dataset of all campaign contributions towards candidate campaigns and committees from 1998 to 2022. We used a hybrid name-based ethnicity-classification method to identify Indian-American campaign contributors, measure their contributions and preferences, and study differences in the community’s contribution behavior with that of the general US population. We further link campaign contribution data to ethnicity-wise population data and electoral outcomes to understand trends in political engagement.
Methodology
There is no direct data identifying individual donors as being of Indian extraction. As a result, in this paper, we estimate who is of Indian origin using the publicly available names for the donors. Since this method offers only an estimation rather than an entirely accurate number, we describe in much detail exactly how we went about arriving at the numbers here. Consequently, it is important to read this paper with care and examine the results given the methodological details. We neither claim to present comprehensive coverage of all persons of Indian American origin, nor a confirmation that those covered in this study necessarily affiliate with their Indian American ethnicity as a driver of their funding behavior.
Data
OpenSecrets Data
Our primary source of campaign contribution data is OpenSecrets, a non-profit which compiles and publishes datasets on campaign finance and lobbying in the United States. OpenSecrets makes detailed information available for each political transaction, including contributions to individuals, candidate committees, and political action committees (PACs). Each such transaction is required to be filed with the Federal Election Commission, which makes the filings publicly available. OpenSecrets then processes and analyzes the data further, making the compiled data available for every electoral cycle.
We analyzed 24 years of OpenSecrets data, spanning six general elections and six midterm elections from 1998 to 2022. This period covers a sharp increase in the amounts of money involved in US elections, with each successive election in the last few years being named the “most expensive election in US history”. Simultaneously, this period covers a steady increase in the population of the Indian-American community and their involvement in US politics. This data allows us to take a close look at how that occurred, pinpointing the key contributors, causes and candidates for Indian-Americans. We also used the FEC’s publicly available filings to cross-reference and supplement the OpenSecrets datasets.

Figure 1: The total amount contributed in each electoral cycle, which has more than doubled over the last decade. Source: OpenSecrets campaign finance data. As we see, the share of Indian Americans is still miniscule, not even showing up visually in the early 2000s
An important part of the increase in funding has been driven by the Citizens United v. Federal Election Commission (2010) decision[1], which allowed corporations to spend unlimited money on independent political ads, so long as they did not coordinate directly with candidates. This led to an almost immediate, measurable increase in spending on US elections, that we see here as well.[2]
Population Data
To compare the number of Indian-American contributors against their population, we used state-wise Asian-Indian population numbers from the AAPI Data Dashboard. AAPI Data publishes annual, granular counts of Asian-American population per state based on data samples from the American Community Survey. This allows us to study the per-capita propensity to contribute among Indian-Americans and the general population. We also study the growth and geographical distribution of the Indian-American community over the years. For demographic information on the general population, we used data from the US Census and the US Census Bureau’s annual population estimates.
Additionally, we merged the OpenSecrets data with data from the MIT Election Data and Science Lab’s dataset containing vote counts for each candidate for the House, Senate and Presidency from 2000 to 2022. This allowed us to study the correlation between campaign contributions and votes received among different candidates.
Name-based Ethnicity Classification
While previous studies on campaign finance in the United States have made use of campaign contribution records (Maglio, 2024) (Bouvette et al., 2025) (Katz, 2024) (Chung et al., 2024), these have been limited by the absence of detailed information on campaign donors. FEC filings include the donor’s name, gender, address and profession, but no other demographic information such as ethnicity, age or nationality. This has restricted analysis to the general set of contributors, preventing meaningful examination of the contribution patterns of any specific sub-groups.
Name-based ethnicity classification provides a way out of this dilemma. Since some names, and some patterns in names, are far more common in some countries and cultures than others, it is possible to create a fairly high-certainty estimate of a person’s ethnicity based solely on their name. However, this is a purely probabilistic estimate without the ability to distinguish between many subtleties which affect how the name should be classified, and without the ability to take into account factors that should affect the likelihood other than the name.
We performed the name-based classification as a pipeline with three stages:
Per-Country Popularity of First Name and Last Name
By using parallel datasets that have names that belong to individuals in India and those that belong to individuals living in the United States, we can come up with a list of intersecting names using the frequency of a name appearing on a set as the indicator of it belonging to that group. Thus a name being classified as ‘Indian’ is done by looking up a name in the two datasets and calculating how much more (or less) popular it is in India than the United States. If it is above a certain threshold of relative popularity, it should be classified as “Indian”; if below a certain threshold then “not Indian”, and otherwise, “indistinguishable”.
The difficulty with this, of course, is that a comprehensive dataset of names per country is difficult to access, if available at all. However, several representative datasets of names have been created from various publicly available sources. Although these certainly don’t represent a majority or even a significant fraction of all names, they are large enough that their distribution of names can be treated as representative of the country’s distribution of name popularity.
Two common approaches to constructing such datasets are to use electoral rolls, which contain massive sets of names from every part of the country; or to use publicly available or scrape-able platforms such as Facebook. The main advantages of using electoral rolls are their greater scale (allowing rarer but still distinctive names to be caught) and accompanying geographic information (allowing names to be tagged to specific parts of the country). In our case, neither of these are necessary at this point (since we do not classify Indian-Americans by state of origin). Additionally, using social media data is more likely to give us a more accurate distribution of names for potential immigrants from India to the USA: such immigrants tend to be affluent, urban, and more likely to be upper-caste Hindus, characteristics which coincide with the individuals who are more likely to use social media.
As a result, we used data from the names-dataset Python package created by Phillipe Remy. The source of the data is the 2021 Facebook dump, which was processed and stripped of identifying information to create the dataset of nearly 500 million pairs of first and last names from 106 countries. Of relevance to us are 32,308,972 names from the United States and 6,161,590 names from India, yielding a combined total of almost 38.5 million names with a ~19% minority class.
For each unique first and last name in the combined dataset, we calculated its relative popularity in India compared to the United States (separately for first and last names). For example, 0.25% of Indian first names are “Vinod”, but only 0.004% of American first names, so “Vinod” is 56.8 times more popular in India than the United States. On the other hand, “Michael” is 0.012 times as popular in India as the United States.
Using such a relative popularity measure is dependent on three things. First, it assumes that the distribution of names chosen by Indians residing in the United States and in India are equal, but this is not necessarily true. Indians who immigrate to the United States are a tiny subset of who are not representative of the larger Indian population, so it’s to be expected that the names popular among the two populations will vary significantly. Second, it assumes that the name distributions of the countries’ datasets are representative of their population, which might not be true – especially in the case of India, there are only 6 million names to infer to a population of 1.46 billion, a sample of about 0.4%.
Third, it assumes that each unique name is unique to a cultural context. This is also not true for many common, short names. A significant example is the last name “Roy”, which is a very common last name in multiple cultures, including among Indian Bengalis. In this case, despite “Roy” being far more popular in India, it would be incorrect to label everyone in the United States with the last name Roy as Indian. Such names are termed as “indistinguishables” by Jain et al. This error is not as significant because within the overall class of names, there are very few names which are ambiguous to Indian and Western cultures. Additionally, the first name can generally be taken into account to remove ambiguity, since the probability of an individual having an ambiguously Indian first name as well as such a last name is negligibly small.
Because of the ambiguity created by the first two assumptions, the relative popularity rates weren’t directly used as ethnicity annotations across the entire set of contributors. Instead, we selected a “safe” threshold – a high multiple of popularity in India – separately for the first and last names, and only annotated names as “Indian” if they were above the threshold. Finally, we manually re-annotated edge-case names such as “Roy”.
Assuming the distribution of names among Indian-Americans and Indians to be identical, one would expect an Indian name to be 66.7 times as popular in India compared to the United States (given that Indian-Americans are 1.5% of the US population). Consider an Indian name with some popularity rate in India, such as 1 in every 100 individuals having the last name “Patel” (hypothetically). If distributions were equal, one would expect 1 in every 100 Indians, or 1 in every 15,000 individuals in the United States to be named “Patel”.
However, it seems extremely unlikely that the distribution of names among the largely urban, white-collar Indian-American class is exactly equal to the distribution of names in largely rural India. Some names will be much more popular or less popular among Indian-Americans than among Indians. For example, 1.2% of Indian names in our dataset have the last name “Patel”, but so do 0.3% of American names, compared to the 0.008% we would have expected had the distributions been equal.
Since the distributions are almost certainly not identical, the threshold we select for relative popularity should be significantly lower than the 66.7 suggested by simply taking the population shares. Names such as “Patel” are clearly at least 10 times more popular among Indian-Americans than Indians. We therefore set our threshold at 5, allowing for some Indian names to be 12.5 times more common among Indian-Americans[3].

Figure 2: Our ethnicity annotations based on the relative popularity of each individual’s first name and last name in India. The blue dots to the far right represent edge-cases such as the last name “Roy”. It is also notable that individuals with popular Indian first names are extremely likely to have Indian last names, but there are many cases of individuals with popular Indian last names and American first names – likely indicating second- or third-generation Indian-Americans.
This allowed us to generate a large set of names annotated as Indian with high certainty. Of course, just these names would be useless as a classification because the large set of names with ambiguous first names (such as Bobby Jindal) or last names (Kamala Harris) would be missed. However, this classification contains valuable information to estimate the patterns which are popular among Indian names, which can then be used as additional information to classify ambiguous names.
n-gram Classification
Consequently, we use the “safe” Indian names annotated based on their relative popularities, as training labels for a recall-weighted classifier which identifies names based on n-grams occurring within them. We use the scheme suggested by Jain et al., who take the first four and last four characters of the first and last names respectively as the n-grams.
However, several complications make using the “ethnicIA” model, or the previous “ethnicolr” model unfeasible. For example, Jain et al. recommend applying their method on a dataset by training on a labelled subset of 20,000 names or so. However, this method fails in the case of an imbalanced set where the subgroup that needs to be distinguished is a small minority in a larger population. For example, Indian-Americans are only ~1.5% of the American population, and would be expected to be ~300 names from a sample of 20,000 – not nearly enough to create representative n-gram statistics.
Oversampling would fail to fix our problem because the ethnicIA method specifically relies on population-level statistics, which require having a pre-existing set of labelled names which are representative of the distribution that needs to be annotated. In our case, this is a chicken-and-egg problem because the distribution of Indian-American names is (presumably) unique, and is different enough from the general Indian population that the only way to have a labelled set is to already have the classifier we are trying to build.
Additionally, a purely probabilistic method such as an n-gram classifier is not desirable in this case. Consider the set of contributor names from the 2016 election. Among 2,436,140 (2.4 million) unique names, we would expect the number of Indian-American names to be in the vicinity of 40,000. In such a scenario, even a classifier with very high accuracy would fail to separate the classes appropriately.
Consider a hypothetical classifier with an accuracy of 90% over the minority class (such as Indian-Americans) and 95% over the majority class. On our dataset of ~2.4 million names with 40,000 Indian-Americans, such a classifier would flag ~154,000 names as Indian-American, of which 36,000 would be True Positives and 118,000 would be False Positives, yielding a precision 23.38%. This is clearly far too low to naively use the classifications in any meaningful analysis.
However, this classification also clearly has some value, given that it reduces the pool of names from ~2.4 million to only ~154,000, while only excluding 10% (given the hypothetical classifier has an accuracy of 90%) of Indian-American names. As a result, such a classifier would still have value as an intermediate step to create “weak labels” for manual verification and annotation.
For the classifier, we used a simple, two-layer feedforward neural network with ReLU for non-linearity and a Sigmoid activation function. Each n-gram feature derived from the first and last game is embedded into a vector space reflecting differing cardinalities and potential information content.
The model was trained and validated on nearly the entire set of names annotated based on their relative popularity, and tested on a small set of 12,000 manually annotated held-out names. These names were chosen because they included the 10,000 highest-contributing individuals in each electoral cycle in our data (1998-2000 to 2020-22). Since most of these, as big donors, are public figures, we were able to use publicly-available information to classify them as Indian or not with extremely high certainty, based on the real-world truth, not just the indication of their names.
Our model yielded a naive accuracy of 99.57%, along with an F1 score of 81.69%, on the validation set of names when compared with the weak labels. Note that in this case, 100% accuracy or F1 score would not actually be desirable, since any names which were not completely obviously Indian were not annotated as Indian in the weak labelling. Consequently, even when the model was recall-weighted by increasing the weightage of the Indian class, it yielded more than 2000 “False Positives” – names classified as “Indian” despite being “Not Indian” in the weak labels.

Figure 3: The confusion matrix for our classifier on our validation set, representing a precision of 83.4% and a recall of 80.05%.
To truly understand the effectiveness of the model, we used it to classify our manually-annotated set of the 10,000 highest-contributing donors from each election cycle (yielding 60,830 unique names). This yielded an accuracy of 99.71% and F1 score of 87.61%, indicating that the model was aligned with our expectation of success and is able to correctly identify names from Indian culture.

Figure 4: The confusion matrix for our classifier on our test set of 60,830 unique donors – the 10,000 highest-contributing donors in each election cycle. The precision score of 86.01% and recall score of 89.26% indicates that the classifier is (correctly) biased towards identifying as many Indian names as possible.
This allows us to efficiently carry out the last step of the classification process: manually verifying and annotating each name classified by the model as Indian.
Estimating the error-rate
One concern with name-based ethnicity classification is that there are several, potentially unavoidable, sources of error. The most fundamental of these is that measuring the ethnicity of a name is a proxy for measuring the ethnicity of a person, particularly in the context of an assimilating immigrant population. For example, while it is unlikely, it is entirely possible for an Indian-American’s descendants to have names which bear no trace of their Indian heritage. Prominent Indian-American figures like Kal Penn and Mindy Kaling, for example, are classified as “not Indian” by every variation of name-ethnicity classifier we tested.
Additionally, name-based ethnicity classification only allows us to study correlations to ethnicities and cultural groups, while most purposes differentiate residents on the basis of nationality or individual country of origin. In the case of ethnicities which are popular in multiple countries, it becomes impossible to make accurate nation-level annotations. This is most relevant to us because of India’s large population of Muslims, who display a large degree of homogeneity in naming patterns across various countries. Since there is no data yet to estimate what fraction of Americans belonging to multi-nation ethnicities are in fact from India, we decided to exclude all such groups entirely.
Consider the case of a contributor named, for example, “Shah Rukh Khan”. The last name “Khan” is popular in India but is even more popular (per capita) in Pakistan, a predominantly Muslim country. This is equally true of Bangladesh, Afghanistan, and several other predominantly-Muslim countries. While the name’s cultural group (or in this case, religion of origin) can be easily classified, it is impossible to say whether the person is “of Indian-origin” with any certainty.

Figure 5: An illustration of the names that should and could be classified as Indian. While we can be certain of correctly classifying names that are popular exclusively in India or outside, names that are geographically ambiguous present a problem.
Similar problems apply to names which are not easily distinguishable as belonging to their (Indian) ethnicities or cultural groups. Names from the North-eastern region of India, for example, would be difficult to distinguish. Another significant demographic which would be undercounted is Christian Indian-Americans. In the case of names such as John Abraham or Faye D’Souza,[4] for example, it is desirable that they are classified as not Indian because both the first and the last names respectively are more likely to be in a set from another country than from India.
Thus, names such as Washington Sundar or Sandeep Fernandes will be classified as Indian, whereas Washington Massey or Tony Fernandes would be excluded. Similarly Mahmood Puthuveetil would be included since such Puthuveetil is a Keralite toponymic surname, whereas Mahmood Khan would be excluded as both Mahmood and Khan are more likely to appear as names in other countries.
| Name | Prediction | Probability |
| Washington Sundar | Indian | 81.85% |
| Washington Massey | Not Indian | 0% |
| Sandeep Fernandes | Indian | 98.39% |
| Tony Fernandes | Not Indian | 0% |
| Mahmood Khan | Not Indian | 0% |
Table 1: Description of what names will and will not make it into the classifier based on first and second name combination to show what kinds of errors are likely to exist in the data.
There are mitigating factors to these problems in applying name-based classification to our dataset. The most prominent of these is that the distribution of campaign contributions is extremely long-tailed. In the 2020 election cycle, despite a total of 3.5 million individuals making campaign contributions, more than 52% of contributions came from only 10,000 individuals. These individuals tend to be public figures, and politically active Indian-Americans have historically received sufficient media interest to be easily identifiable. We used this publicly available information to manually annotate the names of these high-contributing individuals with their ethnicities. As a result, while contributor names are certainly prone to misclassification, we can be confident of correctly annotating all key donors and therefore ensure our estimations of top-line contribution figures are correct within a reasonable margin of error.
Additionally, the ethnicities that we are forced to include are a significant but still fairly small percentage of Indians. Per the last census, Muslims are estimated to comprise about 14.2 % of the Indian population, while Christians comprise about 2%. While there are other religious groups as well, they do not necessarily use different forms for nomenclature, therefore we set an upper bound of our exclusion rate because of these groups at 17%. This is still an estimate – we can conclude that Jain and Sikh names are relatively easy to incorporate into this list and likewise Buddhist names do not use different rules, but there is likely an undercounting of names that belong to marginalized communities of other kinds within the broader Indian tapestry.
Generating Mega-Donor Profiles[1] [2] [3]
One key finding of our analysis is that a small number of wealthy, influential campaign contributors are responsible for the majority of political contributions. These “mega-donors” can disproportionately impact elections by pouring millions of dollars into a single race, and a series of studies in recent US elections have shown that they wield an inordinate amount of power in the conduct of elections.[5] [6]
Among Indian-Americans, there are no contributors of the order of hundreds of millions, but a small handful of Indian-Americans are certainly disproportionately influential. These include politically-engaged venture capitalists, founders & business owners, and “bundlers”. Studying these individuals in greater detail allows us to better understand the few key figures who can contribute large amounts of financial and political capital to candidates.
To this end, we selected the highest-contributing Indian-Americans from every electoral cycle and generated “profiles” for each of them. This includes a short text summary of their background, political leanings, and contribution history, as well as links to publicly available information on the individual.
To generate the profiles, we prompted GPT-4 with each contributor’s transactions per OpenSecrets, as well as generated information from publicly available sources such as Linkedin profiles and Wikipedia pages. A sample of the prompts is attached in the Appendix. The final profiles were read and confirmed by a human author.
Findings
Demographic and Socioeconomic Context
The Indian-American community represents about 1.5% of the American population.[7] It has nearly tripled over the course of the century, from a little over 1.6 million Indian-origin residents in 2000 to more than 4.5 million in 2022. Since this rise in population has been accompanied by increasing political engagement, Indian-Americans in 2025 are a political force to reckon with. This is visible in the campaign contribution records – while only ~0.6% of the Indian-American population in 2000 contributed to political campaigns, this has doubled to more than ~1.3% as of 2022. Understanding the politics of the Indian diaspora is therefore more and more important in the American electoral context.

Figure 6: Indian-Americans have been growing as a share of the population, and have also become more likely to make political campaign contributions Source: OpenSecrets campaign finance data and AAPI Data Dashboard
The rapid growth in the population of Indian-American residents has come largely through the immigration of white-collar workers. As a result, Indian-Americans are among the most affluent and highly educated ethnic groups in the United States. With a median household income of $147,000 and 80% holding a bachelor’s degree or higher (Pew Research Center, 2024), their socioeconomic profile aligns with traditional predictors of political participation, such as higher voter turnout and campaign contributions.
A consequence of this is that Indian-Americans have also rapidly become a politically influential demographic. This is particularly true because, like other immigrant populations, the Indian-American population tends to be highly concentrated in a handful of urban districts with large tech, finance and healthcare industries.
Geographic distribution
To understand the present state of Indian-American campaign contributors, we will use data from the 2020 electoral cycle – the most recent presidential electoral cycle for which OpenSecrets data exists. AAPI Data indicates that only five states accounted for 52.3% of the Indian-American population of the country in 2020. California leads with ~856,000 Indian-Americans, followed by Texas, New Jersey, New York, and Illinois.
| State | Indian- American Population | Indian-American Population % | Indian- American Donors | % contributing | Total Amount Donated (USD) |
| California | 806367 | 2.04% | 9450 | 1.17% | $34,283,005 |
| Texas | 436501 | 1.49% | 3809 | 0.87% | $9,988,052 |
| New Jersey | 384465 | 4.15% | 2504 | 0.65% | $6,458,751 |
| New York | 369362 | 1.84% | 4042 | 1.09% | $14,207,696 |
| Illinois | 242830 | 1.89% | 2168 | 0.89% | $5,679,889 |
| Florida | 175820 | 0.81% | 1919 | 1.09% | $8,162,671 |
| Virginia | 152302 | 1.76% | 1662 | 1.09% | $4,496,842 |
| Washington | 126266 | 1.63% | 1271 | 1.00% | $3,877,750 |
| Massachusetts | 118912 | 1.7% | 1395 | 1.17% | $5,921,364 |
Indian-American contributors to political campaigns are almost identically distributed. California leads with more than 9,000 Indian-American contributors, followed by New York, Texas, New Jersey, and Illinois. Notably, four of the six Indian-American members of the US Congress are from these states – Ro Khanna and Dr. Ami Bera from California, Raja Krishnamoorthi from Illinois, and Pramila Jayapal from Washington.
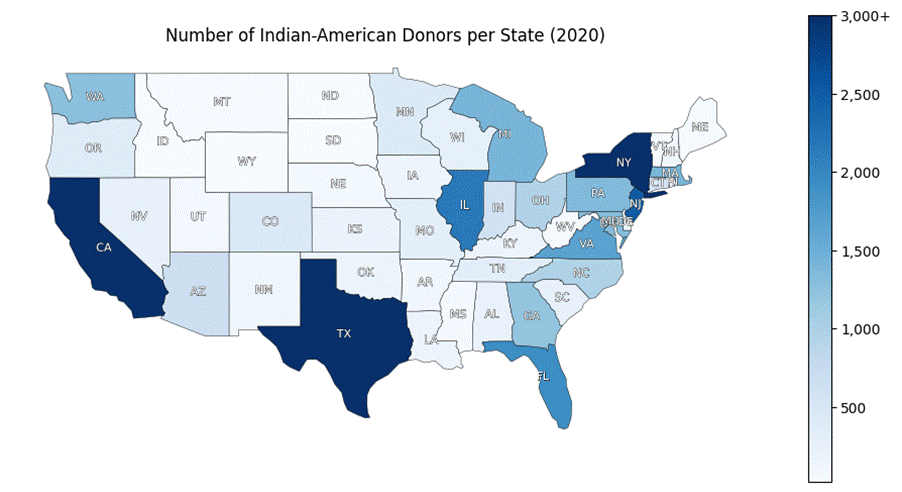
Figure 7: A state-wise map of the number of Indian-American donors identified from FEC campaign contributions records for the 2020 electoral cycle. Source: OpenSecrets campaign finance data
Several other states contain significant populations of Indian-American campaign contributors: Florida, Virginia, Pennsylvania, Massachusetts, and Michigan round out the top 10. Notably, all of these are states with large metropolitan areas, in line with data that the Indian-Americans population clusters in densely-populated urban areas, particularly in California, Texas and the East Coast. Of these states, Virginia and Michigan have one Indian-American Congressional Representative each. Indian-American donors are almost completely absent from the sparsely-populated mountainous northern region of the US – the states of Wyoming, North and South Dakota, Montana and Idaho are home to fewer than 100 Indian-American contributors each.
Key Professional Sectors of Donors
As one would expect, the strong geographic concentration of Indian-American residents reflects in their distribution of professions. More than 40% of all Indian-American contributors whose industry could be identified in the 2020 cycle worked in the healthcare sector, including more than 3,600 Indian-Americans who listed their occupation as “physician”. This is in line with our expectations and past research on Indian-American demographics and politics. As of 2024, at least 6% of the 990,000 doctors registered in the United States were immigrant Indians, despite all Indian-Americans comprising only 1.5% of the population.
Healthcare has long been a sector where the Indian-American community has exerted a great deal of influence. Historically, two of the best-organized groups of political donors in the United States have been physicians and hoteliers. Indian-Americans Physicians have notably organized through the AAPIO (American Association of Physicians of Indian Origin), which has existed in various forms for at least forty years.[8] Consequently, several of the most prominent Indian-American donors come from medical or pharmaceutical backgrounds, including Prem Reddy of Prime Healthcare and Rama Raju Mantena of Ingenus Pharmaceuticals.
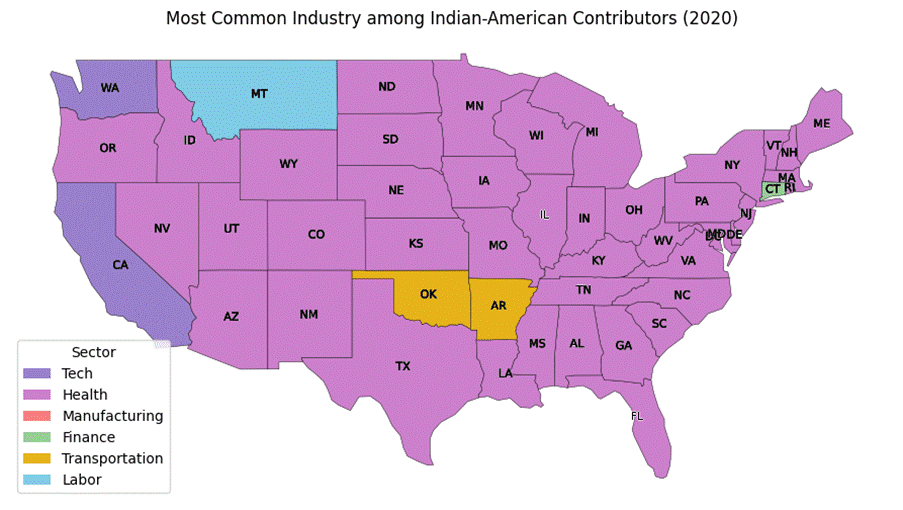
Figure 8: A state-wise map of the most common sector among Indian-American donors identified from FEC campaign contributions records for the 2020 electoral cycle. All sector definitions are based on OpenSecrets’ hierarchical coding system. Source: OpenSecrets campaign finance data
In fact, healthcare professionals constitute the largest industry group of Indian-American contributors in 42 states, representing every state with more than a hundred Indian-American contributors except California and Washington (which are both led by Tech industry professionals).
Many Indian-American contributors also work in the finance (17% of identifiable professions), tech (11.6%), or transportation & hospitality sectors (8.7%). Finance and tech are typical sectors which have seen booms in the immigration of skilled labourers, of which Indian-Americans are a large share – this is exaggerated by the large Indian-American population of California, where both industries are dominant.
By contrast, contributors from the transportation and hospitality sector represent a very different segment of Indian-Americans. Indian-Americans are dominant in hotels and motels across the United States, often belonging to the “Patel” Gujarati subcaste. Over time, they have also become an effective political influence. Similar to the AAPIO, members of the hospitality industry have organized through the AAHOA (Asian American Hotel Owners Association). Perhaps the most famous of these contributors was Sant Singh Chatwal, an associate of Bill Clinton and Democrat mega-donor until he was convicted for the use of straw donors.
When measured by contributions (in USD) rather than the number of contributors, Indian-Americans in the finance industry appear significantly more influential than in healthcare. In the 2020 election cycle, Indian-American finance professionals contributed a total of ~$24.8 million, while healthcare professionals contributed ~$20.2 million. The tech industry is a distant third, representing ~$7.4 million in contributions, while the transportation & hospitality industry contributed only ~$2.5 million despite including more than ~1,700 Indian-Americans.

Figure 9: A state-wise map of the highest-contributing sector among Indian-American donors identified from FEC campaign contributions records for the 2020 electoral cycle. All sector definitions are based on OpenSecrets’ hierarchical coding system. Source: OpenSecrets campaign finance data
Measured by dollars contributed, finance emerges as the most influential sector in 7 states, including of the states with the largest Indian-American populations such as California, New York, New Jersey, and Illinois. Tech emerges as the highest-contributing sector in 4 states, including Washington and Massachusetts, while healthcare remains the highest-contributing sector in 29 states.
The Growing Role of Money in US Elections
In 2010, the Supreme Court ruled in Citizens United v. FEC that campaign contribution is a form of protected free speech under the First Amendment, opening the door for large-scale contributions to political action committees and electoral causes. Since then, US elections have seen larger and larger amounts of money involved, with more and more political influence accruing to a handful of billionaires and prominent political donors.
Remarkably, almost $12 billion was raised for the 2020 election, nearly double the $6.6 billion raised for the 2016 election. FEC filings indicate that this figure has further doubled, with $24.3 billion raised for the 2023-2024 election cycle. This represents every successive election becoming more and more expensive, as the two major parties engage in an arms race fought over unavoidable advertisements and ground campaigns.
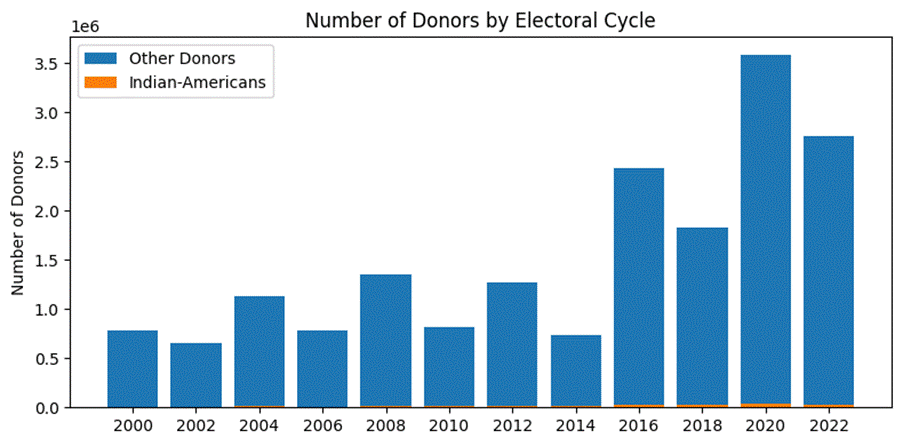
Figure 10: The number of campaign contributors, among Indian-Americans and the general population, 2000-2022. Source: OpenSecrets campaign finance data
Increases in political fundraising in the last decade have come from a combination of more Americans contributing to campaigns, as well as large donors contributing larger amounts every cycle. Since 2010, the number of contributors to political campaigns in the United States has increased steadily, from 1.2 million in the 2012 cycle to almost 3.6 million in 2020, the most recent presidential cycle for which OpenSecrets has released data. The increased focus on PACs has also shifted the balance of campaign finance from small political contributions by citizens, to large donations from corporations, special interest groups, and affluent individuals.
Indeed, the share of campaign contributions coming from the highest-contributing donors has increased sharply – from 28.9% in the 2010 cycle to more than 50% in each of the four most recent recorded election cycles (2016-2022). The 2008 election cycle was the last time that the contributions of the 10,000 biggest political donors accounted for less than 30% of campaign contributions.

Figure 11: Share of contributions in each cycle that came from the 10,000 highest-contributing donors in that cycle. Source: OpenSecrets campaign finance data
As a result, a majority of contribution dollars increasingly come from a small number of disproportionately influential, high-contributing “mega-donors”. Because their contributions are so large, these individuals can swing the balance of money from one side to the other. For example, during the 2020 election, Sheldon and Miriam Adelson alone contributed nearly $100 million to various Republican candidates and committees. Similarly, Timothy Mellon contributed $45 million during the same cycle, and he alone accounted for close to two thirds of the entire amount given by contributors from Wyoming ($72 million).
For a sense of how the scale changed by the 2024 election, over half a billion dollars towards the Trump cause came from just three donors — Elon Musk clocking in at over $275 million, Timothy Mellon at about $150 million, and Miriam Adelson at over $100 million (per FEC data).

Figure 12: Share of contributions in each cycle, separated based on whether the recipient was a candidate (or candidate committee) or PAC, for both parties separately. Source: OpenSecrets campaign finance data
Simultaneously, a growing share of campaign money today is channeled through candidate committees and PACs, which are exempt from candidate contribution limits. PACs have particularly been used heavily by the Republican party – Republican PACs received more than $2.5 billion during the 2020 cycle, a significant fraction of the ~3.7 billion they raised in total. Much of this reflects Donald Trump’s heavy reliance on his “SuperPACs” to fund his campaigns, including the Trump Victory Fund and the Trump Make America Great Again PAC.
Cultural Context of Political Donations
The United States’s culture of widespread and legal political contributions is unique. In India private political contributions tend to be viewed with skepticism, because the general norm is that it is either the candidate themselves or the party, or well-heeled individuals or groups with vested interests in seeing them win fund campaigns. A significant mechanism for campaign finance, called electoral bonds, was recently struck down by the Supreme Court of India (Association for Democratic Reforms v. Union of India, (2024)).
First-generation Indian immigrants often have little exposure to the culture of legal and transparent political contributions that characterizes American elections. Donating to political campaigns is a learned behavior for Indian-Americans which reflects their assimilation into U.S. civic norms. Overall, we find that Indian Americans contribute to political elections at a broadly comparable level to Americans across ethnicities, though this excludes the fact that Indian Americans tend to be much wealthier than the average American which suggests their contributions should be higher.

Figure 13: The share of Indian-Americans and non-Indians who contribute to political campaigns, from 2000-2022. Source: OpenSecrets campaign finance data, AAPI Data Dashboard
In fact, the 2020 election cycle was the first time that a smaller percentage of Indian-Americans contributed to a political campaign than the average across the United States. This further illustrates the wide difference between Indians and Indian-Americans, whose political preferences seem much more in line with any other group of wealthy, educated Americans. We see also another very consistent pattern in Figure 14 below, that while the median spend by Indian American donors is fairly close to that of non Indian Americans and higher in most years (which would make sense as the community is relatively wealthier), the mean spend in elections is far lower for every cycle except for 2016, the Trump-Hillary showdown.
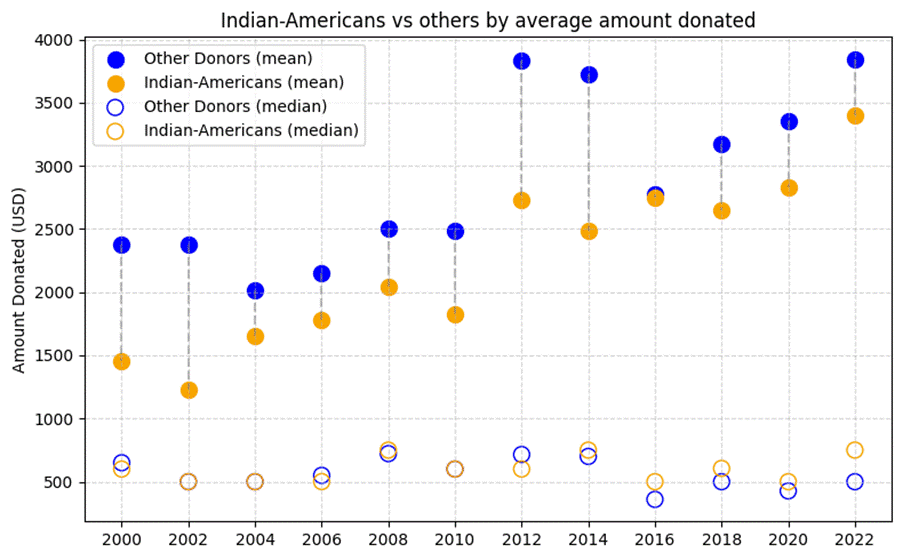
Figure 14: The average amounts contributed by Indian-Americans and other donors from 2000-2022. Source: OpenSecrets campaign finance data
This gap is critical in understanding the overall influence of Indian Americans in elections: Contributions from Indian-Americans during the 2020 cycle were only $122 million. This amounts to only a little more than 1% of the $12 billion raised during this period, significantly lower than the population proportion of 1.5%. This helps understand the lack of “mega-donors” with outsized impact on the administration. For instance, The highest-contributing Indian-American in the 2020 election was Vinod Khosla, who gave $2.4 million. By contrast, the highest-contributing donor overall was Timothy Mellon, who gave $45.1 million, almost 20 times as much. Similarly, the total amount donated by the 100 biggest Indian-American contributors was only about 4% of the amount contributed by the 100 biggest contributors overall ($35.8 million vs $911.2 million).
A pattern that has been consistent with US elections has been the appointment of mega donors into positions of power in the government. While the top donors rarely have the bandwidth to take on a government position (Elon Musk being an exception), there are ample examples of donors being appointed as ambassadors or even as cabinet level secretaries.[9] Another category of “rewarded” individuals in the political funding process include the ‘bundlers’ who may not donate massive sums themselves, but play a role of fundraising among key communities. Several Indian Americans, including Ajay Bhutoria, Swadesh Chatterjee, Ramesh Kapur, Shekar Narasimhan, Deven Parekh, Shefali Razdan Duggal, Frank Islam, and Shalabh Kumar are already known within political circles as major fundraisers.
Nevertheless, the number of Indian-Americans amongst the top 10,000 donors has virtually doubled every four years since 2004. To illustrate this explosion, consider Nirmal Chatterjee – the 10th highest-contributing Indian-origin donor in the 2012 election cycle, who gave about $89,000. In the 2020 cycle, the 10th most prominent donor gave nearly ten times as much – $860,000. Chatterjee himself, who donated $130,000 during the 2020 cycle, fell to 75th position.
The Recency of Indian-American Political Influence
Till the turn of the millennium, the Indian-American population was relatively small and, with minimal organized influence. While there was an Indian American representative, DS Saund, as far back as the 1950s, his Indian ethnicity was not part of his campaign — if anything it was underplayed. Saund did win in the Imperial County of California, which was near a Sikh farming community. However, it was not politically organized around candidates from within the community, and although Saund won three times, there has never since been an Indian-American elected to that seat.
The first hints of political consciousness among Indian-Americans began to take root in the early 1990s, as various linguistic communities began to form cultural associations. This period also saw immense political tumult back home in India. The Indian economy was liberalized and opened up for investment in 1991, and was soon followed by the destruction of Ayodhya’s Babri Masjid which polarized the country along religious lines.
Scholars of Indian political science cite this period as the beginning of the explosion of strident Hindu nationalism, the ideology which dominates Indian politics today. The effects of this explosion were felt in America too, with the emergence of groups such as the Hindu Students Council, the OFBJP, and VHP America. The ties of these groups with the Indian BJP were explicit. Soon, in 1994, under the leadership of Congressman Frank Pallone, the Congressional India Caucus was founded.
One of the first prominent Indian-American politicians this century was Bobby Jindal (born Piyush Jindal), who became a member of the House in 2004 and Governor of Louisiana in 2007. In stark contrast to his peers, Jindal is a lifelong Republican with hardline conservative positions. He remains the only Indian-American elected to US Congress on a Republican ticket, serving as an early predecessor to the likes of Vivek Ramaswamy and Nikki Haley.
Unlike Bobby Jindal, the majority of prominent politicians of Indian-origin have leaned towards the Democrat end of the spectrum. Indian-Americans rose to prominence in Congress in the mid-2010s, starting with the election of Dr. Ami Bera from California’s 7th District in 2012. Dr. Bera was soon joined by three other Indian-Americans in 2016, and the ‘Samosa Caucus’ now stands at six members.
Over the first two decades of the 21st century, the Indian-American community underwent a radical transformation, tripling in size while becoming more politically embedded and engaged. During the 2000 electoral cycle, there were 6,700 Indian-Americans who contributed to political campaigns. By the 2020 election cycle, this number had increased by nearly 550%, to more than 43,000 Indian-American contributors. During this time, the Indian-American population only increased by about 200% (from ~1.6 million to ~4.9 million).
These changes have also come about at a time when campaign contributions have become much more common in general – the number of contributors in the general population has also seen a 250% increase over the same period. This can in part be attributed to the increasing polarization in US society, and the idea of every election as one of critical importance. Prior to the last decade, most political lobbying by Indian-Americans was done by members of the healthcare and hospitality industries. The AAPIO and AAHOA both served to protect members from discrimination and provided a convenient venue for political organization. With the rise and fall of the dot-com bubble, tech entrepreneurs and professionals who immigrated from India also accumulated some influence.
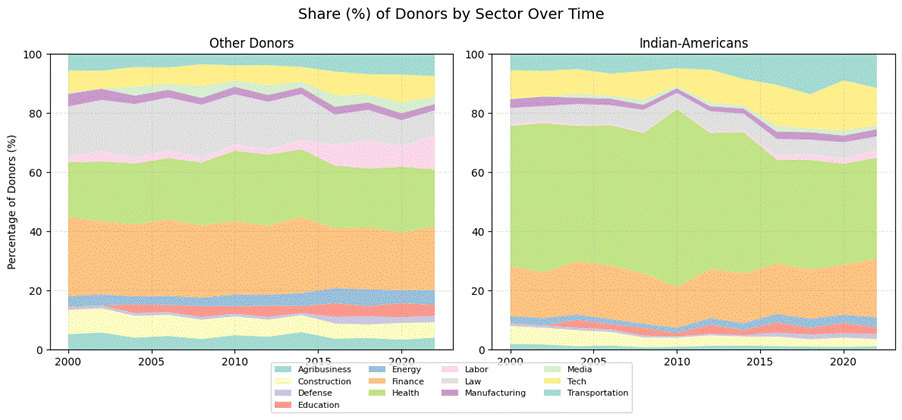
Figure 15: Share of sectors among Indian-American and other contributors in each election cycle. Source: OpenSecrets campaign finance data
While the healthcare industry is still a major source of contributions from Indian-Americans, its share of Indian-American contributors has actually fallen over the years as a more diverse set of Indians become politically active and start contributing to campaigns.

Figure 16: Share of sectors (measured in contributions, USD) for Indian-American and other contributors in each election cycle. Source: OpenSecrets campaign finance data
When the share of sectors is calculated based on contribution amounts rather than the number of contributors, healthcare’s declining influence is even clearer. Contributions from the finance industry have risen steadily over the past two decades, with an even sharper increase among Indian-Americans than the general population. Finance professionals have consistently been the highest-contributing segment among Indian-Americans since the 2016 election cycle. As of the 2022 cycle, close to 50% of all contributions from Indian-Americans were from finance professionals. Only ~7% of contributions from Indian-Americans in the 2022 cycle came from tech professionals, compared to ~20% in 2000, which was an anomalous year possibly because of the tech boom. These trends highlight how the focus of the community has shifted over the years with the emergence of more Indians in finance, including high-profile donors such as venture capitalists Vinod Khosla and Sameer Gandhi.
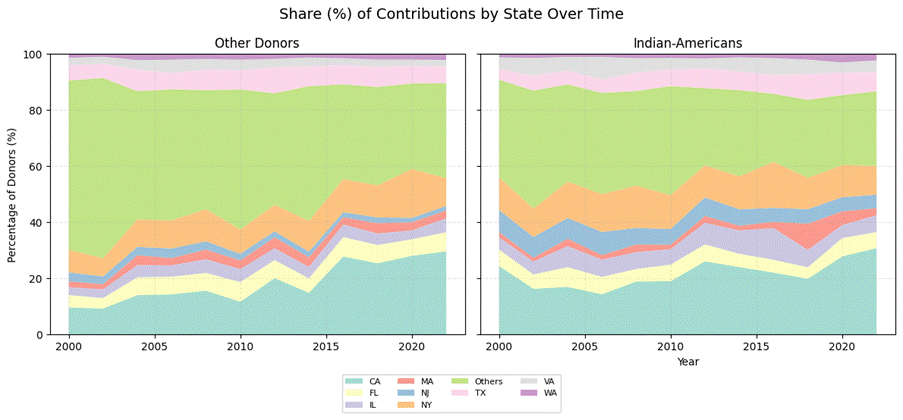
Figure 17: Share of US states (measured in contributions, USD) for Indian-American and other contributors in each election cycle. Source: OpenSecrets campaign finance data
Studying the geographic distribution of Indian-American campaign contributions shows that California, which has consistently been home to the largest Indian-American population, is also consistently home to the largest number of Indian-American contributors. The distribution of Indian-Americans among the states has remained fairly stable, with New York, New Jersey, Florida, Texas and Illinois consistently accounting for the majority of Indian-American campaign contributions.
While much of Indian-American political activity today is centered on traditional progressive issues, bilateral issues between India and the United States have also been an area of focus. In 1998, India conducted a series of five nuclear tests which demonstrated nuclear weapon capabilities. In response, countries including the United States imposed economic sanctions. Through the late Clinton- and early Bush eras, the movement to roll back these sanctions drove a great deal of Indian-American political engagement.
In the wake of these developments, the United States India Political Action Committee (USINPAC) was founded in 2002. Modelled after the Israel lobby, USINPAC specifically aimed to influence Congressional votes on India-related issues. In 2003, USINPAC successfully lobbied to amend a $3B Pakistan aid package, conditioning it on ending cross-border terrorism. Later, it was crucial to the passage of the US-India Civil Nuclear Agreement, which cleared the way for India’s nuclear program. USINPAC’s influence faded by the end of the 2010s with the decline in hot-button bilateral issues between the two nations.
One prominent Indian-American of the early period, Sabeer Bhatia, deserves special mention. In 2000, the Hotmail founder rose to prominence as the first big Indian-American political donor. Bhatia raised $600,000 for Al Gore’s presidential campaign, one of the first in a long tradition of presidential campaign fundraisers hosted by Indian-American “bundlers”. Others of this period included Vinod Gupta, the former CEO of infoGroup, and Dinesh Sastry, a long-time political donor and organizer.
Bhatia was an early recogniser of the role that political funding can play for Indian-Americans, claiming at the turn of the century that it is important for Indians “to make a dent politically.” Over the following two decades, Indian-Americans made increasingly large amounts of political contributions, primarily to various progressive causes. While the community has always been small, its wealth and engagement enabled it to become a large source of political funds.
Indian-American “Bundlers”
Direct donations are not the only way in which Indian-American influence is felt, however. The Indian-American community has produced a large class of “bundlers”, the super-funders who organize fundraisers and collect contributions from other donors to deliver to campaigns. Such campaign deputies have become increasingly prominent since Bhatia’s time, often courted by candidates seeking support from a community. A single fundraiser organized by a bundler group can raise millions of dollars while requiring the candidate to do nothing more than show up for a short meet-and-greet.
Prominent Indian American bundlers include the aforementioned Sabeer Bhatia in the early 2000s, and more recently, Ramesh Kapur and Vivek Murthy. They tend to be influential members of the Indian-American community who have the social standing to organise fundraising drives and marshal votes. Bundlers like Kapur and Murthy stay in touch with the campaign offices of political candidates, who reward them with recognition as a function of their fundraising efforts. Simultaneously, they serve as intermediaries for less-connected but well-off members of the diaspora. As a result, these fundraising events frequently serve as an opportunity to rub shoulders with candidates running for office and remind them of issues important to the community.
Indeed, many presidential candidates reward their bundlers with plum positions in the administration upon reaching the White House. George W Bush famously rewarded his “Pioneers” and “Rangers” with recess appointments en masse, and his successors continued the tradition. That’s how Vinai Thumapally, a prominent Indian-American bundler for the Obama campaign, became the US ambassador to Belize.
Data on presidential campaign bundlers is infamously patchy because candidates are not required to disclose their donors’ names. Republican candidates have failed to disclose them since Mitt Romney’s 2012 campaign, while Kamala Harris in 2024 claimed the dubious honour of being the first Democratic presidential candidate who didn’t disclose it. However, available data paints a clear picture of Indian-Americans bundlers being more and more prominent. During the 2020 election, Indian-Americans raised at least $2.5 million and comprised 3% of Joe Biden’s bundlers – fully twice their representation in the US population. Given reports of Indian-American fundraisers turning out in greater numbers than ever for Harris, their influence is only expected to have risen.
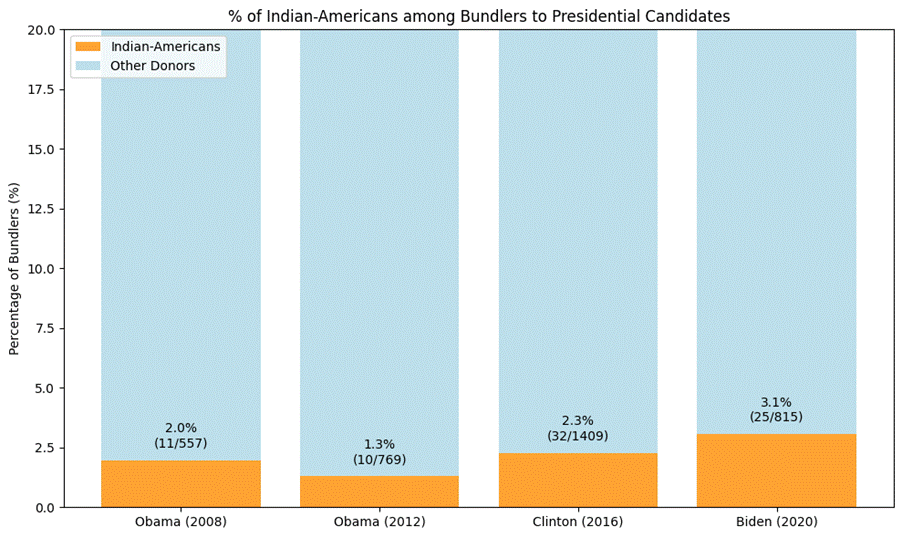
Figure 18: The share of Democratic candidates’ bundlers who have been Indian-American since 2008. Data before 2008 is no longer available. John McCain, the last Republican to release his list of bundlers, included only one potential Indian-American: Richard Kapadia. Source: Candidate websites, WhiteHouseForSale.org
Indian-Americans vs. Hindu-Americans
Although Hindus compose the majority of Indians as well as Indian-Americans, it’s important to draw a distinction between the two. The policy positions of Indian-Americans, particularly prominent Indian-Americans political figures, are often very distinct from conventional Hindu political talking points.
An illustrative example of this crucial difference is Tulsi Gabbard, the Democrat-turned-Republican former representative from Hawaii’s 2nd district. Though she has broken records for being the first Hindu to hold various US offices, Gabbard is not actually Indian-American and in fact has only visited India once – in 2014, at the invitation of Narendra Modi. Gabbard’s sole link to India is through the US wing and allies of the Rashtriya Swayamsevak Sangh (RSS), a Hindu nationalist paramilitary organization and affiliate of the BJP (Modi’s party). Gabbard’s ties to various Hindu nationalist organizations are well-publicized, and have been criticized by progressive politicians, as well as by moderate-minded Indian-Americans.
While the politics of most Indian-Americans align with progressive Democratic values, the Hindu nationalist agenda is significantly different. In contrast to the liberal pluralism advocated by most Indian-American politicians, Hindu nationalists target a Muslim-free, Hindu-run India, and use the Indian diaspora and their international wings to promote their ideology. These causes are championed by organizations such as the Hindu American Foundation, the Vishwa Hindu Parishad of America, and Sewa International. These stand in stark contrast to organizations such as USINPAC, which often advocate for policies in the opposite direction. Shalli Kumar, an Illinois-based Republican donor has been in the news several times for promoting Hindu-leaning funding, while on the West coast, Romesh Japra is an organizer in the South Bay area in California. Their exact impact is not known.
Indian-American Political Preferences
One interesting finding from the Indian-American Attitudes Survey (2020) is the ideological hypocrisy of Indian-Americans. The survey found that Indian Americans’ views are significantly more liberal on American issues, and more conservative back in India. Similarly, despite the clear parallels between Donald Trump and Narendra Modi, Indian-Americans have a much more favourable view of Modi and his policies – perhaps helped by the BJP’s extensive Indian-American outreach program.
This connection to Indian politics has shown up from time to time on US soil – perhaps most prominently in the aftermath of the 2019 “Howdy Modi” rally. Democrat Sri Preston Kulkarni, a prominent Indian-American politician and challenger for Texas’s 22nd Congressional district, made an appearance at the rally. His campaign, however, was subsequently derailed by outrage over his attendance at the rally and his ties to the Hindu right.
One of Kulkarni’s biggest backers was Ramesh Bhutada, a prominent member of the US wing of the RSS (Bhutada was also an early backer of Tulsi Gabbard). While these connections won Kulkarni support and financial backing from many Hindu-Americans, he quickly found out that the majority of Indian-Americans are generally distanced from the polarizing politics associated with the Hindu right. When Kulkarni’s RSS associations became public, the backlash from Muslim and moderate Hindu constituents from his district sapped all momentum from his candidature, which was built largely on support from immigrant communities.
This incident highlights how complex the politics of the Indian-American community are, in stark contrast to recent political trends in India. Despite a perception that Indian-American voters have recently swung to the right, they have been a consistently and solidly Democrat-leaning bloc. Across nearly every state and industry, Indian-Americans contribute to Democrats more than Republicans, and are universally significantly more Democrat-leaning than their counterparts.
The Indian-American Attitudes Survey from 2020 and 2024 reports that the majority of Indian-Americans intend to vote Democrat, a leaning which has remained relatively stable over the years. All six members of the “Samosa caucus” currently in Congress are affiliated with the Democratic party, as are most prominent Indian-origin politicians – including former Vice-President Kamala Harris and NYC mayor-hopeful Zohran Mamdani.
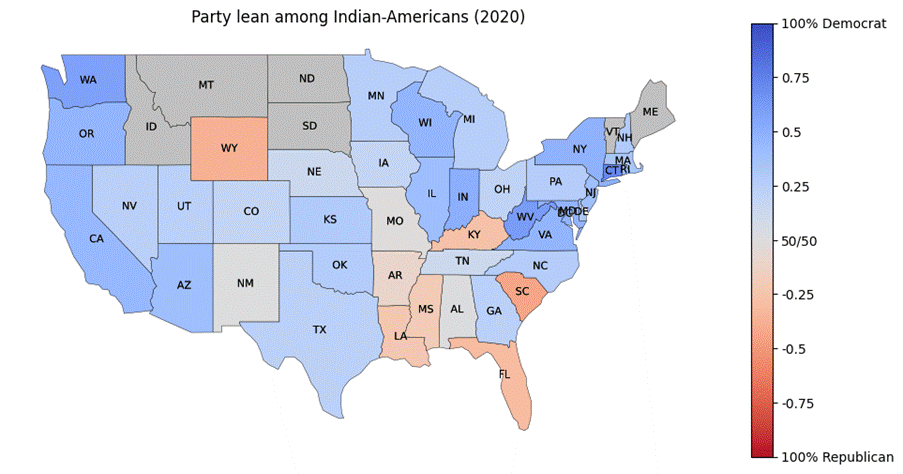
Figure 19: A state-wise map of the ratio of contributions from Indian-Americans towards Democrats versus Republicans. 1 (Dark Blue) indicates 100% of contributions went to Democrat candidates and committees, while -1 (Dark Red) indicates 100% to Republicans. States with less than $100k in Indian-American contributions are coloured in grey. Source: OpenSecrets campaign finance data
During the 2020 election cycle, Indian-American contributions overwhelmingly favoured Democrats. Indian-Americans gave a total of $46.6 million to Democrats during the 2020 cycle, and only $16.3 million to Republicans. This was distributed to 656 Democrat candidates, compared to only 484 Republican candidates.
In 38 states, including all ten states with the highest Indian-American populations and contributors, Indian-Americans contributed more to Democrats than Republicans. This preference for Democrats is also consistent across industries: in the 2020 electoral cycle, Indian-Americans from every industry favoured Democrats more than their non-Indian counterparts.
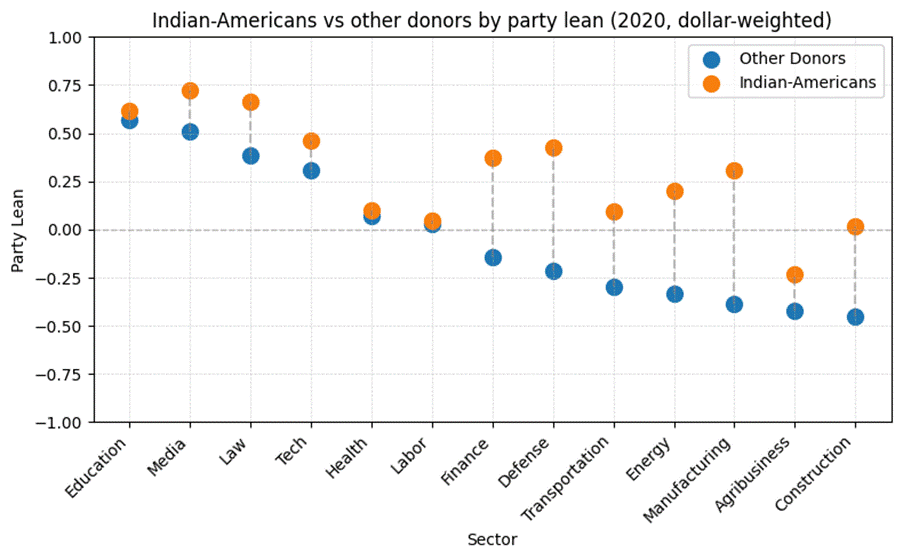
Figure 20: A plot of the party leaning of contributions from Indian-Americans versus the general population across sectors of employment, for the 2020 election cycle. Source: OpenSecrets campaign finance data
Notably, not only are Indian-Americans more Democrat-leaning than the general population, they are also Democrat-leaning in absolute terms across every industrial sector. During the 2020 cycle, Indian-Americans from every sector except Agribusiness contributed more to Democrats than Republicans.
Splitting this analysis based on Congressional and Presidential candidates allows us to take a deeper look. In every presidential election after2000, Indian-Americans have supported the Democrat candidate by increasingly large margins. This trend peaked in 2016, when Indian-Americans contributed ~$8.7 million to Hilary Clinton and only ~$700,000 to Donald Trump (excluding PAC funding).
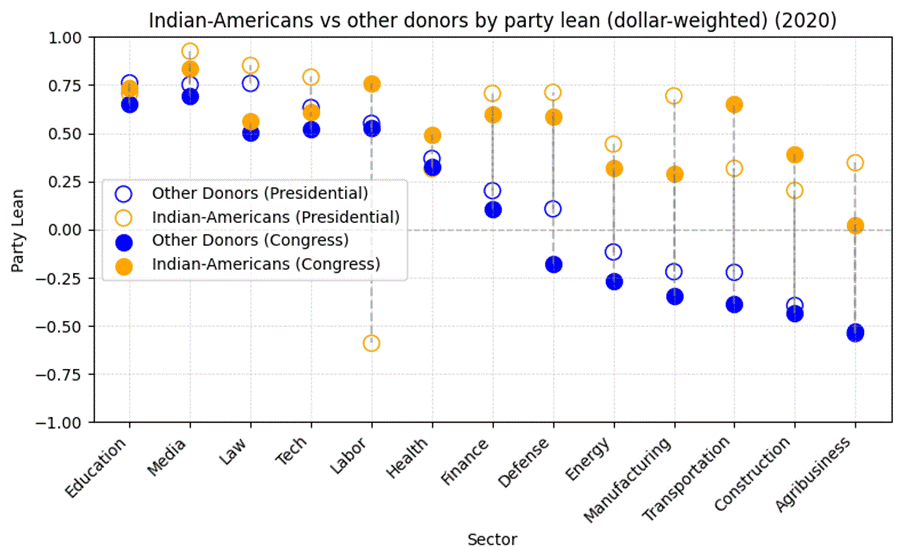
Figure 21: A plot of the party leaning of contributions from Indian-Americans versus the general population across sectors of employment, separated by presidential and congressional contributions, for the 2020 election cycle. Source: OpenSecrets campaign finance data
One identifiable pattern here is that both Indian-Americans and the general population seem to be more willing to support the Democrat presidential candidate than Democratic Congressional candidates. This could possibly be a “Donald Trump” effect, or possibly simply a product of voters being more conservative in races that are more local.
Across presidential and congressional races, Indian-American contributions are substantially more Democrat-leaning than their counterparts. The ideological divide grows even wider for more conservative industries, as Indian-Americans (with the exception of Agribusiness donors) remain fairly uniformly Democrat-leaning, with scores between 0.25 and 0.75.
This can be attributed in some part to the demographics of the community, which is largely urban, affluent and has relatively high degrees of college completion compared to other Americans. The states and cities where Indian-Americans have settled also plays a role — the strong Democratic bias of Indian-Americans coincides with a strong bias for residence in Democrat-leaning states like California, New York, Illinois, Washington, and New Jersey . Here, even Indian-Americans in traditionally Republican-leaning industries tend to favour Democrats.
For example, contributions during the 2020 cycle from the agribusiness industry as a whole were split between Republicans and Democrats in an approximately 75:25 ratio. Among Indian-Americans however, 72% of the total contribution of more than $320k came from donors in California and New York, which went almost entirely to Democrats. California dominates the distribution of contributors, leading with 26/98, with no other state numbering more than 6. Further, almost half of the dollar amount comes from a single contributor, Dinny DeVitre in New York, whose links to the Agribusiness industry are tenuous at best. This helps account for the absence of Republican contributions among Indian-Americans even from the sectors where one would expect conservative interests to proliferate.
Through case studies of key Indian-American segments, we can better understand the movers and shakers among Indian-Americans. For example, two sharp outliers in the trend of Indian-Americans leaning strongly towards Democrats are Wyoming and Florida, both of which favoured Republicans by large margins.
A closer look at the data reveals the reason behind this anomaly. In 2020, the sum of political contributions from Indian-Americans in Wyoming amounted to only about $200,000 – unsurprising as AAPI Data reported an Indian-American population of only 563 in Wyoming in 2020. Nearly 90% of their contributions were from just three people, all of whom contributed exclusively to Republicans, thereby accounting for the state’s Republican bias.
These three mega-donors are King Husein, a first-generation immigrant from Mumbai and the founder of Span Construction & Engineering; Diane Husein (nee Clark), his wife; and Farid Khan, a hotelier and member of the “Khans of Wyoming” whose family immigrated from what is now Pakistan between the 1900s and 1960s.
Indian-Americans from Florida make more campaign contributions than any state except California and New York, totalling ~$8.1 million during the 2020 election cycle. However, nearly half of all contributions from Florida’s Indian-Americans in that cycle came from just three people: Raj Mantena, a prominent figure in healthcare who serves as the CEO of Ingenus Pharmaceuticals and founder of Integra Connect; Padmaja Mantena, his wife; and Nirmal Mulye, founder and President of Nostrum Pharmaceuticals. While the remainder of the Indian-American population of the state is evenly split between the two parties, the overwhelmingly large proportion of contributions from these three mega donors are the reason that Florida’s Indian-American contributions lean Republican as a whole.
There has been a widespread perception that the Indian-American community has jolted to the right in the 2024 election cycle. There is some support for this – the Indian American Attitudes Survey of 2024 found that only 61% of those surveyed said they’d vote for Harris, compared to 68% who said they’d vote for Biden in 2020. It is important to contextualize these movements along the political spectrum with the group’s longer history though.
From the 2000 election cycle all the way to 2020-2022, Indian-Americans have become progressively more Democrat-leaning. While the community favoured Democrats by a ratio of about 55:45 in 2000, that figure had reached nearly 75:25 by 2022.
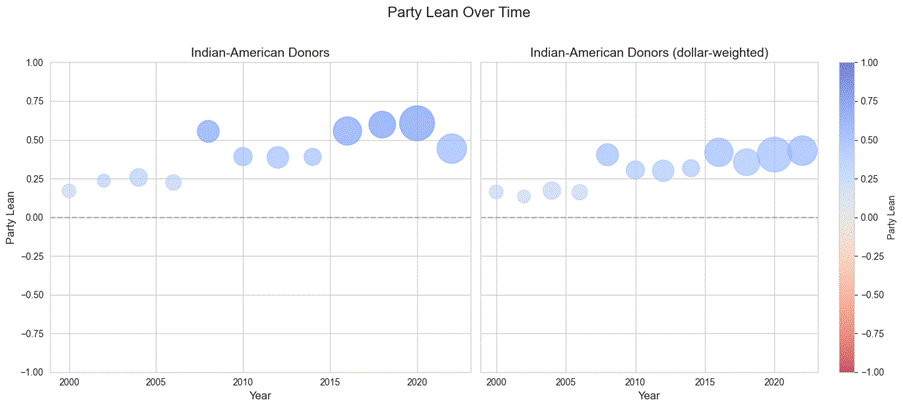
Figure 22: The party leaning of contributions from Indian-Americans from 2000-2022. Source: OpenSecrets campaign finance data
This effect is visible as a steady movement, uniformly across the years, and applies to contributions to presidential candidates, congressional candidates, as well as PACs. During the 2022 election cycle, more than 80% of Indian-American contributions to congressional candidates went to Democrats. This sentiment has peaked twice: once during the 2006-2008 cycle, and again during 2020-2022, with both cycles seeing more than 80% of contributions going to Democrats.
There is a similar but much stronger trend in the way Indian-Americans’ preferences have changed in the presidential races. As recently as 2000, Indian-Americans contributions net favoured the Republican candidate (George W Bush). Since then, from 2004-2012, both John Kerry and Barack Obama received significantly more support than their opponents (approximately 60-70% of contributions). In recent years, Hilary Clinton (2016) and Joe Biden (2020) both received even more lopsided support, receiving 75%+ of Indian-American presidential contributions.
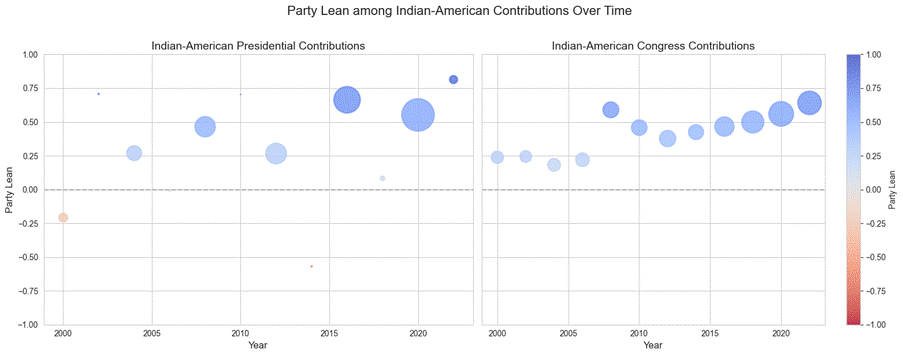
Figure 23: The party leaning of contributions from Indian-Americans from 2000-2022, separated by presidential and congressional contributions. Source: OpenSecrets campaign finance data
The data indicates that contributions to PACs tend to favour Republicans much more than contributions to candidates. While this remains true for Indian-American contributions to PACs, they remain Democrat-leaning, though by a lower margin than contributions to presidential or congressional candidates.
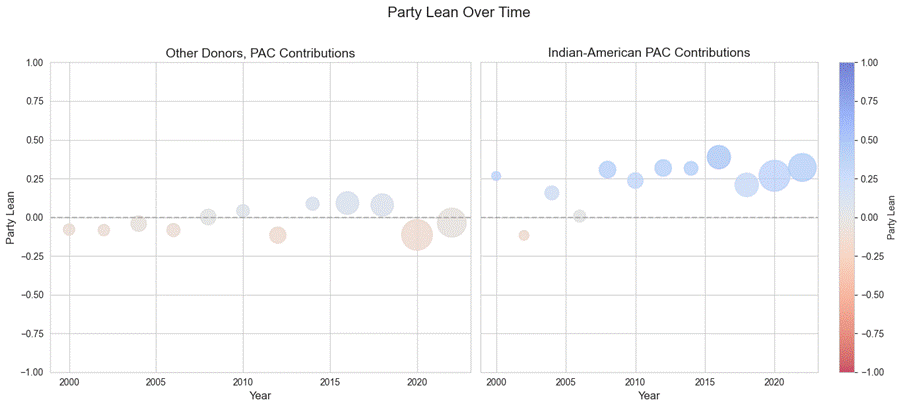
Figure 24: The party leaning of contributions from Indian-Americans and other donors towards PACs, 2000-2022. Source: OpenSecrets campaign finance data
Note that these figures are calculated on the totality of Indian-American contributions in each electoral cycle. Breaking down the contributions by sector and state allows us to discover more nuanced changes over the last decades.
One of the highest-contributing segments, particularly in recent years, has been the finance industry – both among Indian-Americans and in general. While the broader finance industry has traditionally been viewed as a Republican-supporting demographic, this is less true in recent years, and has never been true for Indian-Americans. Indian-American finance professionals, for example, made more than 75% of their donations to Democrat candidates and committees, a sharp and steady increase from the slight lean towards Democrats that they exhibited in the early 2000s. This ideological shift also coincides with a sharp increase in contributions from Indian-Americans in finance, surging more than tenfold to reach $25.9 million in the 2020 cycle.
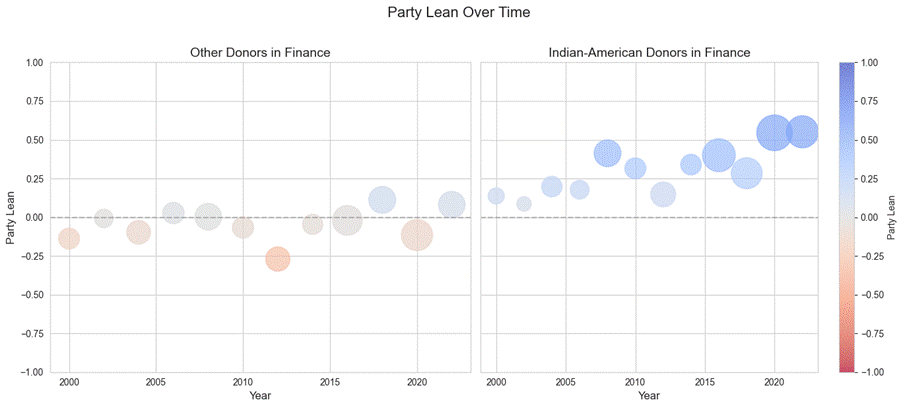
Figure 25: The party leaning of contributions from Indian-American finance professionals from 2000-2022. Source: OpenSecrets campaign finance data
The finance industry’s increasing amounts of campaign contributions and heavy Democrat-preference have been crucial in making Indian-Americans a significant Democrat fundraising segment. With their growing influence and organization, strong community ties, and wealth, Indian-Americans have the potential to be a significant source of funds for progressive causes in the United States over the coming years. Although it’s clear that Indian-Americans strongly prefer the Democratic party, it is also worth taking a look at the candidates who best succeed at fundraising from the community.
Indian-Americans’ Favourite Candidates
The candidates who raise large amounts of funds from Indian-Americans tend to meet at least one of two criteria: they are either progressive candidates under the Democratic party, or they are Indian-origin (or otherwise connected to India), or both. We can evaluate how much the Indian-American community approves of a candidate by looking at two metrics: the absolute amount contributed to them by Indian-Americans; and the share of total funds raised by the candidate which came from Indian-Americans.
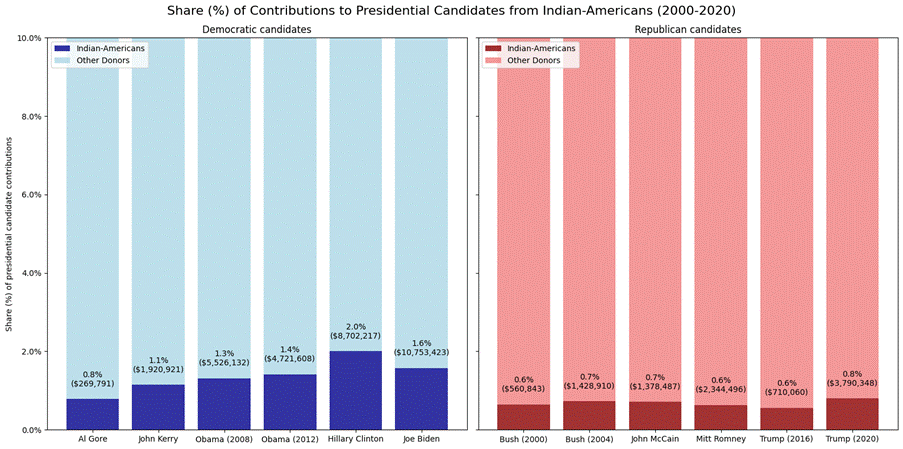
Figure 25: The share of funds raised by each presidential candidate which came from Indian-Americans, 2000-2020. Source: OpenSecrets campaign finance data
Among presidential candidates, the growing Indian-American influence and preference for Democrats is clear. While less than 1% of Al Gore’s funds came from Indian-origin donors, the figure reached 2% for Hillary Clinton, totalling $8.7 million. Joe Biden surpassed even her with $10.7 million, though the proportion decreased to 1.6%. Nevertheless, every single Democratic candidate has been more reliant on Indian-American funding than their Republican counterpart, with Republicans never raising more than 0.8% of their funds from Indians.
The presidential candidates most favoured by Indian-Americans, however, have both failed to secure the nomination. Tulsi Gabbard’s 2020 candidature for the presidency attracted by far the most support from Indian-Americans. She raised almost a million dollars from the community, representing nearly 13% of her $7 million raised in total. This fits with Gabbard’s extensive ties to the Indian-American community and the Hindu right, who have supported her throughout her career.
The other presidential candidate with heavy Indian-American support was the one responsible for bringing Indian-Americans to the national political stage: Bobby Jindal. His short-lived bid for the presidency in 2015-16 raised $1.2 million in total, of which nearly $80k (6%) came from Indian-Americans. Although he wasn’t a major candidate, his run paved the way for Indian-Americans to aspire to the highest offices.
Although complete data on the 2024 election is not yet available, it seems clear that Kamala Harris has succeeded in his fundraising footsteps. Reports suggest that Harris raised millions from Indian-Americans for the 2024 election, aided by organizations such as South Asian Women and Men for Harris. This is despite her complicated relationship with her Indian heritage, which she has chosen not to highlight in favour of her African-American roots.
Nevertheless, Harris has always been successful with the Indian-American community. During her 2020 presidential bid, she raised almost a million dollars from donors of Indian-origin, which formed nearly 3% of the funds she raised in total. Harris fits into the the other set of candidates who receive large amounts of support from members of the Indian-American community – candidates who are themselves of Indian-origin, or with ties to India.
Among Congressional candidates, this is the dominant theme. The candidate with the most money raised from Indian-American donors is Shiva Ayyadurai, the conspiracy-theorist who ran as an independent and Republican candidate in 2018 and 2020. Ayyadurai is himself Indian-American and self-funded the campaign, explaining his position on the chart. His massive contributions to himself not only place him as the best-funded Indian-American candidate from the Republican party, but also one of the biggest Indian-American donors to the Republican party.
Immediately behind Ayyadurai is Suraj Patel, the ex-Obama aide and Democratic candidate who thrice challenged for New York’s 12th congressional district seat. Suraj Patel’s fundraising appears to have followed an incredibly successful strategy of reaching out to donors from his Gujarati community. Across his three runs from 2018 to 2022, he raised a total of $6.65 million, of which approximately $5.5 million came from Indian-Americans. Remarkably, a full $4.38 million of this money came from at least 737 people with the last name “Patel” – representing nearly 80% of all money he raised from individual Indian-American contributors. Patel’s fundraising strategy is a good example of the strong community links that persist among Indian-Americans today, and the increasing financial might of Indian-American political donors.
Ayyadurai and Patel are followed by some less colourful candidates who tend to be progressive, or of Indian origin, or both. Krishna Bansal, the Indian-American entrepreneur who challenged for Illinois’ 11th district seat as a Republican in 2020, received more than $150,000 from Indian-Americans, representing more than 80% of his contributions. Many of his donors were other members of the Indian-American business community in Illinois.
Other candidates who raised more than 75% of their funds from Indian-Americans include Rishi Kumar, the Democratic candidate who has run for a House seat from California thrice, from 2020-2024. Ravi Patel, an Indian-American hotelier who contested Iowa’s 1st Congressional district Democratic primary in 2016, followed a similar fundraising strategy to Suraj Patel. Like Suraj, Ravi Patel raised more than 75% of his funds from Indian-Americans, and more than 80% of that came from donors with the last name “Patel”. Swati Dandekar, another Indian-American who contested in the Democratic primary in the same district in 2014, also raised more than $400k of her total of nearly $600k from Indian-Americans.
Another candidate who notably raised the majority of their funds from Indian-Americans is the long-time Indian-American Democratic representative from California, Ro Khanna. Khanna ran in the Democratic primary for California’s 12th Congressional district in 2004, long before his rise to prominence in the 2010s. During his first run, he leaned heavily on Indian-Americans for support, raising more than $250k out of his ~$320k from Indian-origin donors. While their prominence among his funders has decreased over time, Indian-American donors remain important to his campaigns.
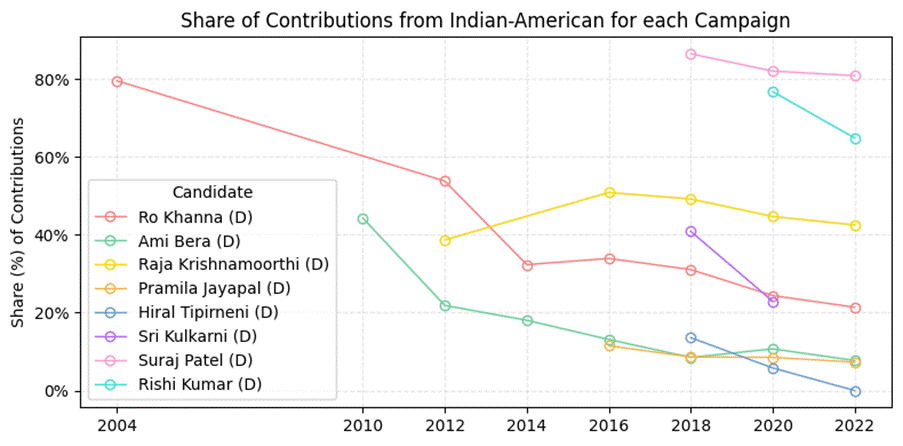
Figure 26: The share of eachIndian-American candidate’s campaign contributions that came from Indian-Americans, 2004-2022. Source: OpenSecrets campaign finance data
Ro Khanna’s example highlights a significant trend in the way these Indian-origin candidates receive support from their community. In Ro Khanna’s case, 80% of the funds for his first attempt in 2004 came from members of the Indian-American community. In his 2012 run, which was his last loss, a little over 50% of contributions came from Indian-Americans, while in 2014, his first win, a little under 33% were from Indian-Americans. By 2022, following three more consecutive wins, only a little over 20% of his raised funds were from Indian-Americans.
This pattern of decreasing reliance on Indian-Americans funds over time is visible among almost every Indian-American candidate with multiple electoral runs in the past decades. It is visible among the Indian-origin candidates who rely largely on Indian-American funding, such as Ro Khanna and Raja Krishnamoorthi, as well as those who don’t, such as Pramila Jayapal and Hiral Tipirneni.
This phenomenon is a clear indicator of the community’s role as a “launchpad” for its candidates. As in the case of Tulsi Gabbard, candidates with ties to the Indian-American community depend on their support to become known to a broader audience. After initial successes, they have a bigger platform and the ability to raise funds from a more diverse coalition – but, as the Indian-American community must hope – they wouldn’t forget the donors who backed them early on.
Key Segments
While Indian-Americans are influential in several states and sectors, a handful of these segments account for the majority of Indian-American contributions. We take a closer, in-depth look at some of these states and industries, to better understand how they have shaped Indian-American politics.
California
California is home to 20% of all Indian-Americans (Pew Research Centre, 2024) and similarly, home to approximately one-fifth (21%, in 2022) of Indian-American campaign contributors. As per the Census Bureau, a staggering 513,000 Indian-Americans live in the San-Jose-San-Francisco-Oakland Combined Statistical Area, who, with their 231,000 compatriots in Los-Angeles and Long Beach, make up 7% of the total Indian-American population (U.S. Census Bureau, 2023).
Given Indian-Americans are one of the most affluent ethnic subgroups, and California is one of the most affluent regions in the United States, it is no surprise that a very large proportion of Indian-American campaign contributions have typically flowed from California. In both the 2020 and 2022 electoral cycles, approximately 30% of all money contributed by Indian-Americans came from California. This represented more than three times the share of the next-highest-contributing state (New York). This also represented the peak of an upward trend – at its lowest in 2006, the figure was only 15%, but has since ranged from 20-30%.
By far the most significant contributor group within California is professionals and executives from the finance industry — which in California is somewhat intertwined with tech since a lot of these finance professionals are in venture funding. In the 2020 electoral cycle alone, these individuals contributed more than $10 million. This is a good representation of how concentrated Indian-American financiers are in California, as well as how important they are to the influence of the community at large. Their contributions represent more than 40% of the ~$34 million contributed by Indian-Americans from California, and 16% of the entire amount contributed by Indian-Americans in that cycle.
Some of the top donors from venture capital and tech include the two highest contributing Indians of the 2020 cycle, Vinod Khosla and Sameer Gandhi. Khosla and Gandhi have been active donors throughout the 2010s as well, frequently figuring in the top 10 Indian donors in every election cycle since the election of Barack Obama. Khosla, a prominent progressive donor, is the founder of Khosla Ventures, through which he invests heavily in clean energy solutions. Before this, he was the co-founder of Sun Microsystems, which was acquired by Oracle in 2010. Sameer Gandhi is a venture capitalist at Accel and Sequoia Capital, and is known for his investments in Dropbox and Spotify.
It is notable that despite Indian-Americans forming a sizable minority in Silicon Valley, and the tech industry being synonymous with Silicon Valley, Indian-Americans in tech contribute far less than their counterparts in the finance industry. In the 2020 cycle, they contributed a total of $7.4 million, only a fifth of the amount given by those in finance. This might be explained in part by major software entrepreneurs making their fortunes through acquisitions, transitioning into venture capital roles or semi-retirement before becoming major campaign contributors.
Despite the finance industry dominating California’s Indian-American campaign dollars and the tech industry dominating its perception, the healthcare industry is a large force among Indian-Americans in California, as in the rest of the country. Healthcare industry workers from California contributed $3.7 million in the 2020 cycle, more than any other industry except finance. Further, while the finance industry makes larger contributions and the tech industry yields more contributors, the healthcare industry is comparable to both, with more than 6,500 contributors donating a total of more than $20 million in the 2020 election cycle.
It is also home to one of the most prominent Indian-American campaign contributors, Prem Reddy, a cardiologist and healthcare magnate who founded Prime Healthcare, a hospital chain. A Republican, he donates to GOP candidates (including Trump) and opposes single-payer healthcare, citing free-market principles. He has given more than $2.2 million from 2018-22 alone. While his contributions before the recent few cycles were much smaller, this matches a broader pattern of new mega-donors emerging in recent years, such as Sivakarni Sambasivam of GoodRx, who contributed more than $700k in the 2020 cycle despite never having contributed before. Unlike Reddy, the tech executive donated exclusively to the Democratic Party, backing Presidential candidate Kamala Harris.
New York/New Jersey
The metropolitan area of New York is home to a larger share of the Indian-origin population than anywhere else, with over 700,000 members of the Indian-American community residing there (U.S. Census Bureau, 2023).
Like California, the financial sector is responsible for the bulk of the political contributions from Indian-Americans in New York. In 2020, 6 of the top 10 Indian-origin donors from New York worked in the financial sector, all of whom contributed almost exclusively to the Democratic Party.
Chief among these donors is Bharat Bhise, the co-founder of Bravia capital – a firm that focuses on aviation-related investments. Like Sambasivam in California, Bhise emerged as a large donor only in 2020, with a total contribution of $660,000 in the 2020 cycle despite previously making no major political contributions. Other major donors in the financial sector include Tushar Gupta, Deven Parekh, Karamjit Kalsi, and Sanjiv Ahuja.
Finance
Among major Indian-American donors in the finance and business sectors, several stand out for their political contributions. Vinit Bodas, founder of Deccan Value Investors, donates to both major parties with a slight Republican lean which includes contributions to Ted Cruz. His wife, Uma Bodas, a healthcare philanthropist, donates exclusively to Democratic candidates who emphasize healthcare access. Sunil Puri, an Illinois real estate mogul and founder of the First Rockford Group, represents a strong Republican presence, directing substantial contributions to Donald Trump and Illinois conservatives in line with his support for pro-business and deregulatory policies.
Other figures display more consistent Democratic alignments. Sanjeev Mehra, a former Goldman Sachs partner and founder of Periphas Capital, has directed most of his contributions toward Democrats such as Barack Obama and Joe Biden, reflecting the finance sector’s general Democratic lean. Similarly, Samir Kaul, a colleague of Deven Parekh at Insight Ventures, has supported Democratic candidates focused on advancing scientific research. In contrast, Nachhattar Chandi, who built his fortune in convenience stores and gas stations, underscores the diversity within the donor community, contributing heavily to Donald Trump and the Republican National Committee – marking him as a notable exception to the broader Democratic preference among Indian-American donors.
Healthcare
The American Association of Physicians of Indian Origin (AAPIO) has long been a significant lobbying force, advocating on healthcare issues while also fostering networks within Washington DC’s ecosystem. Notably, a group of Indian-origin physicians, including prominent Republican donors like Raghavendra Vijayanagar and Zach Zachariah, played a pivotal role in forming the first Indian American Republican Council, backing George W. Bush in the 2000 election. Their activism laid the groundwork for future political involvement from Indian-Americans in the healthcare industry.
Besides the standard Indian-American hotbed of California, major donors in the healthcare industry come from Florida and Washington. Reflecting its nature as a long-time swing state, prominent Indian-American healthcare donors in Florida contributed more evenly between the two parties than their counterparts in New York and California. While over 77% and 79% of Indian-American contributions from New York and California in the 2020 cycle were to Democrats respectively, only 60% of such contributions in Florida went blue. In the healthcare sector specifically, 56% of Indian-American contributions from Florida were to Democrats, lower than any other major state.
This is reflected in the pattern of donations in the healthcare industry in general, where the richest donors often spread their money between the major parties. As previously discussed, two-thirds of all contributions from Florida’s Indian-Americans in the 2020 cycle, for instance, came from just three people: Raj Mantena, a prominent figure in healthcare who serves as the CEO of Ingenus Pharmaceuticals and founder of Integra Connect; Padmaja Mantena, his wife; and Nirmal Mulye, founder and President of Nostrum Pharmaceuticals. The Mantenas have been prominent players in the Indian-American medical community for years, through their association with AAPI. A consequence of this pattern of donation is that though a lion’s share of individual donations from Indian-Americans in the healthcare community are to the Democratic party, the dollar amounts are far more evenly split.
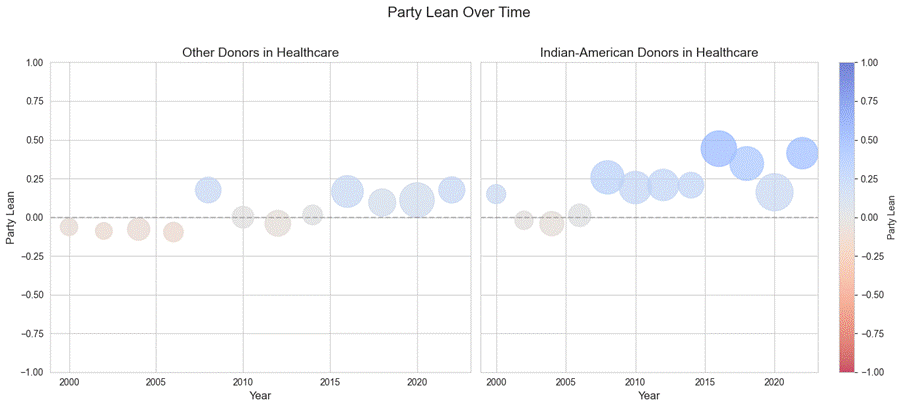
Figure 27: The party leaning of contributions from Indian-American healthcare professionals from 2000-2022. Source: OpenSecrets campaign finance data
References
Asian American and Pacific Islander Data. (2024). AAPI community counts dashboard [Interactive dashboard]. https://explore.aapidata.com/#dashboard
Bhattacharya, A. (2020, November 4). These are the Indian-Americans who raised over $100,000 each for the Biden-Harris campaign. Quartz. https://qz.com/india/1926857/us-election-these-indian-americans-raised-funds-for-biden-harris
Bouvette, M., Beveridge, S., Kumar, K., Ali, M., Dvorak, J., Choradia, N., & Nipp, R. (2025). A 10-Year Comparative Analysis of Medical and Surgical specialty lobbying by physician professional Organizations. Health Affairs Scholar, 3(7). https://doi.org/10.1093/haschl/qxaf140
Browse Individual contributions – FEC.gov. (2025). FEC.gov. https://www.fec.gov/data/receipts/individual-contributions
Center for Responsive Politics. (2024). Campaign contributions by state [Data set]. OpenSecrets. https://www.opensecrets.org/bulk-data/downloads#by-state
Chung, H., Cullerton, K., & Lacy‐nichols, J. (2024). Mapping the lobbying footprint of harmful industries: 23 years of data from OpenSecrets. Milbank Quarterly, 102(1), 212–232. https://doi.org/10.1111/1468-0009.12686
Federal Election Commission. (2010). Citizens United v. FEC. FEC.gov; Federal Election Commission. https://www.fec.gov/legal-resources/court-cases/citizens-united-v-fec/
Federal Election Commission. (2024). Individual contributions to candidates, parties, and PACs [Data set]. https://www.fec.gov/data/receipts/individual-contributions
Federal Election Commission. (2024, September 25). Statistical summary of 18-month campaign activity of the 2023–2024 election cycle [Data summary]. https://www.fec.gov/updates/statistical-summary-of-18-month-campaign-activity-of-the-2023-2024-election-cycle/
Hinduism Today. (1993, October). 10,000 Rally in Wash. D.C. To Honor Vivekananda – Hinduism Today. Hinduism Today. https://www.hinduismtoday.com/magazine/october-1993/1993-10-10-000-rally-in-wash-d-c-to-honor-vivekananda/
Jain, V., Enamorado, T., & Rudin, C. (2022). The Importance of Being Ernest, Ekundayo, or Eswari: An Interpretable Machine Learning Approach to Name-Based Ethnicity Classification. Harvard Data Science Review. https://doi.org/10.1162/99608f92.db1aba8b
Janardhanan, Vinod (2013). “Political Participation of the Indian Diaspora in the USA,” Journal of International and Global Studies: Vol. 5: No. 1, Article 2. DOI: 10.62608/2158-0669.1164. https://digitalcommons.lindenwood.edu/jigs/vol5/iss1/2
Katz, N. (2024). Federal election commission records as qualitative data: a historical network analysis approach. Interest Groups & Advocacy. https://doi.org/10.1057/s41309-024-00219-5
Maglio, D. (2024). How super PACs supercharge fundraising and spending for candidates in presidential primaries. STARS. https://stars.library.ucf.edu/hut2024/113/
MIT Election Data and Science Lab. (2017). U.S. House 1976–2020 vote totals [Data set]. Harvard Dataverse. https://doi.org/10.7910/DVN/42MVDX
MIT Election Data and Science Lab. (2017). U.S. Senate 1976–2020 vote totals [Data set]. Harvard Dataverse. https://doi.org/10.7910/DVN/PEJ5QU
MIT Election Data and Science Lab. (2017). U.S. President 1976–2020 vote totals [Data set]. Harvard Dataverse. https://doi.org/10.7910/DVN/IG0UN2
Pal, J. (2024, October 8). The long history of Indian American lobbying in US – and why it still isn’t influential enough. Newslaundry. https://www.newslaundry.com/2024/10/08/the-long-history-of-indian-american-lobbying-in-us-and-why-it-still-isnt-influential-enough
Patel, S. (2020, October 22). How Trump & Biden Get Funds From Desi Bundlers’ “Elite” Parties. TheQuint; The Quint. https://www.thequint.com/south-asians/trump-biden-us-presidential-election-2020-fundraising-desi-bundlers-chai-party#read-more#read-more
Pew Research Center. (2024, August 6). Indian Americans: A Survey Data Snapshot. Pew Research Center. https://www.pewresearch.org/2024/08/06/indian-americans-a-survey-data-snapshot/
Pew Research Center. (2021, September 21). Religious Composition of India. Pew Research Center. https://www.pewresearch.org/religion/2021/09/21/religious-composition-of-india/
PTI. (2012, September 3). Indian-Americans open up wallets for Obama; little for Romney. The Times of India; Times Of India. https://timesofindia.indiatimes.com/nri/us-canada-news/indian-americans-open-up-wallets-for-obama-little-for-romney/articleshow/16232651.cms
Remy, P. (2022). Name dataset [Data set]. GitHub. https://github.com/philipperemy/name-dataset
Springer, R. (2000, June 27). Indian Americans host fund-raiser for Gore. SFGATE. https://www.sfgate.com/news/article/Indian-Americans-host-fund-raiser-for-Gore-3055886.php
The Center for Responsive Politics, NW, charitable organization 1300 L. S., Washington, S. 200, & info, D. 20005 telelphone857-0044. (n.d.). Lobbying Data Summary. OpenSecrets. https://www.opensecrets.org/federal-lobbying/
U.S. Census Bureau. (2023). Detailed race: Asian alone or in any combination by selected groups (B02018) for the United States and Alabama [Data table]. Data.census.gov. Retrieved September 2, 2025, from https://data.census.gov/table?q=B02018&g=010XX00US$31000M1_040XX00US01
U.S. Census Bureau. (2024). State population totals: 2020–2023 [Data set]. https://www.census.gov/data/tables/time-series/demo/popest/2020s-state-total.html
https://data.census.gov/table?q=B02018&g=010XX00US$31000M1_040XX00US01
Vaishnav, M. (2017). When crime pays : money and muscle in Indian politics. Yale University Press.
Appendix – Process for Profile Generation
This section outlines the methodological approach employed to generate and verify biographical and political contribution profiles of prominent Indian-American donors using large language models (LLMs). The process was designed to ensure accuracy, transparency, and reproducibility while acknowledging the inherent limitations of automated data collection and analysis.
User prompt example:
“Can you give me a one paragraph biography that includes:
where the person is from/born and resides
what they do or work in or how they made their fortune/what are they famous for
what are their politics like, which party do they donate to”
The research utilized OpenAI’s ChatGPT (GPT-4) to synthesize donor profiles from publicly available information. The LLM was guided by structured prompts that requested specific data points: (1) place of birth and current residence, (2) professional background or source of wealth, and (3) notable political donations from 2016 to 2024, including partisan lean where discernible. Prompts were iteratively refined to improve precision, particularly for common names where disambiguation was necessary.
Primary data validation relied on three key sources. Federal Election Commission (FEC) records, accessed via OpenSecrets.org, served as the authoritative source for political contributions. Professional backgrounds were cross-referenced against LinkedIn profiles, corporate websites, and reputable business publications such as Forbes and Bloomberg. In a second iteration of profile-generation, we included the employers of the donors whose employment data was available in their FEC filings, allowing for a more detailed response.
The methodology incorporated specific protocols to handle ambiguous cases. For names with multiple potential matches, the LLM was instructed to prioritize individuals with verifiable political donation records and U.S.-based professional activities. When no reliable information could be found, the output explicitly stated this limitation on instruction to avoid generating speculative content.
[1] Citizens United v. FEC, 558 U.S. 310 [2010]
[2] Douglas M. Spencer and Abby K. Wood, “Citizens United, States Divided: An Empirical Analysis of Independent Political Spending,” Indiana Law Journal 89, no. 1 (Winter 2014): 315–72
[3] Note that in the absence of a principled way to estimate the popularity distributions and how they differ across the two countries, we selected this threshold empirically and manually adjusted outlying first and last names.
[4] The name Faye D’Souza however is an interesting case in point because the Goan-Christian names of India follow patterns that are more likely to exist in India and to some extent in Portugal than among people in other countries with Latino-Hispanic roots as it mixes an Iberian last name ‘D’Souza’ with an English first name ‘Faye’ a pattern common in India.
[5] Hertel-Fernandez, Alexander, Theda Skocpol, and Jason Sclar. “When political mega-donors join forces: how the Koch network and the democracy alliance influence organized US politics on the right and left.” Studies in American Political Development 32, no. 2 (2018): 127-165.
[6] Kates, Sean, Eric Manning, Tali Mendelberg, and Omar Wasow. “Plutopopulism: Wealth and Trump’s Financial Base.” American Political Science Review (2025): 1-18.
[7] https://www.census.gov/programs-surveys/acs
[8] Joyojeet Pal. “The Long History of Indian American Lobbying in US – and Why It Still Isn’t Influential Enough.” Newslaundry, October 8, 2024. https://www.newslaundry.com/2024/10/08/the-long-history-of-indian-american-lobbying-in-us-and-why-it-still-isnt-influential-enough
[9] To name a few, these include Obama appointees Penny Pritzker and John Roos, Biden appointees David Cohen and John Tsunis, and Trump appointees Betsy DeVos and Linda McMahon
@vishnu.prakash2304@gmail.com are we linking to the website here?
_Assigned to vishnu.prakash2304@gmail.com_
yes
whereare the links?
Leave a Reply